Much to our surprise, Vancouver real estate is back. The latter half of 2016 saw a number of interventions by the BC Liberal government to curb speculative property purchases by non-residents and cool an overheated housing market.
While sales are inching closer to the record-breaking pace of 2016, the market itself looks different. Sales last year were driven by demand for single-family homes. Demand this year has been increasing for months and supply is not keeping pace. This dynamic is causing prices to increase and making multiple offer scenarios the norm.
It’s clear that townhomes and condominiums are leading the way. First-time buyers and people looking to downsize from their single-family homes are both competing for these two types of housing.
Condo Prices
Vancouver condo prices in particular hit record highs. According to the Real Estate Board of Greater Vancouver (REBGV), the benchmark price hit $571,300, a massive 17.8% increase from the same month last year. This is also a 3.1% jump from the month prior. REBGV president Jill Oudil claimed single-family homeowners downsizing to condos added additional pressure to prices. This has resulted in deep-pocketed boomers competing in the same market traditionally driven by first-time buyers.

Figure 1: Vancouver Condo Benchmark Price (October 2015 – May 2017) (Source: REBGV)
In May 2016, the average sale price was $659,919, up 3.49% from just last month. The increased average indicates a premium being paid, which is likely attributed to a preference for luxury units.
Condo Sales
Sales of condos reached 2,025 in May 2017, a decrease of 5.8% compared to the 2,150 sales in May 2016. This represents a 17.8% increase over May 2016 and a 3.1% increase compared to April 2017.
Sales-to-Active Listings Ratio
The sales-to-active listings ratio across all residential categories is 53.4%, up 8% from April 2017. Generally, analysts say that downward pressure on home prices occurs when the ratio dips below the 12% mark for a sustained period, while home prices often experience upward pressure when it surpasses 20% over several months.
By property type, the ratio is 31% for detached homes, 76.1% for townhomes, and 94.6% for condominiums. Again, demand for condos and townhomes is driving today’s activity.
When comparing condo sales and listing data from the past two years, inventory has been at its highest in May 2017 than it has been for the past two years.
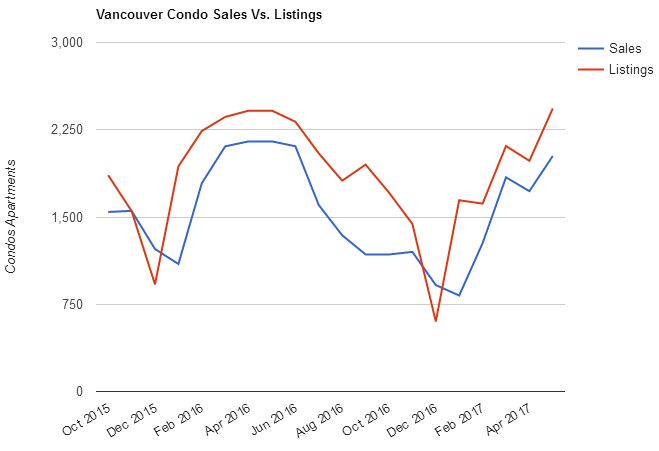
Figure 2: Vancouver Condo Sales vs. Listings (October 2015 – May 2017) (Source: REBGV)
The minor increase in inventory and the decline in sales shouldn’t technically send prices higher – but it did. First-time buyers entering the market without the need to take on massive debt loads might lead to a healthier mortgage book. However, it will most likely bring the floor of home prices up.
——————————————————————————————————————————————————————————————–
Real Estate Board of Greater Vancouver, “Market activity picks up in May”, accessed June 24, 2017, http://www.rebgv.org/news-statistics/market-activity-picks-may


